Insurance in the Digital Era
Member Portal
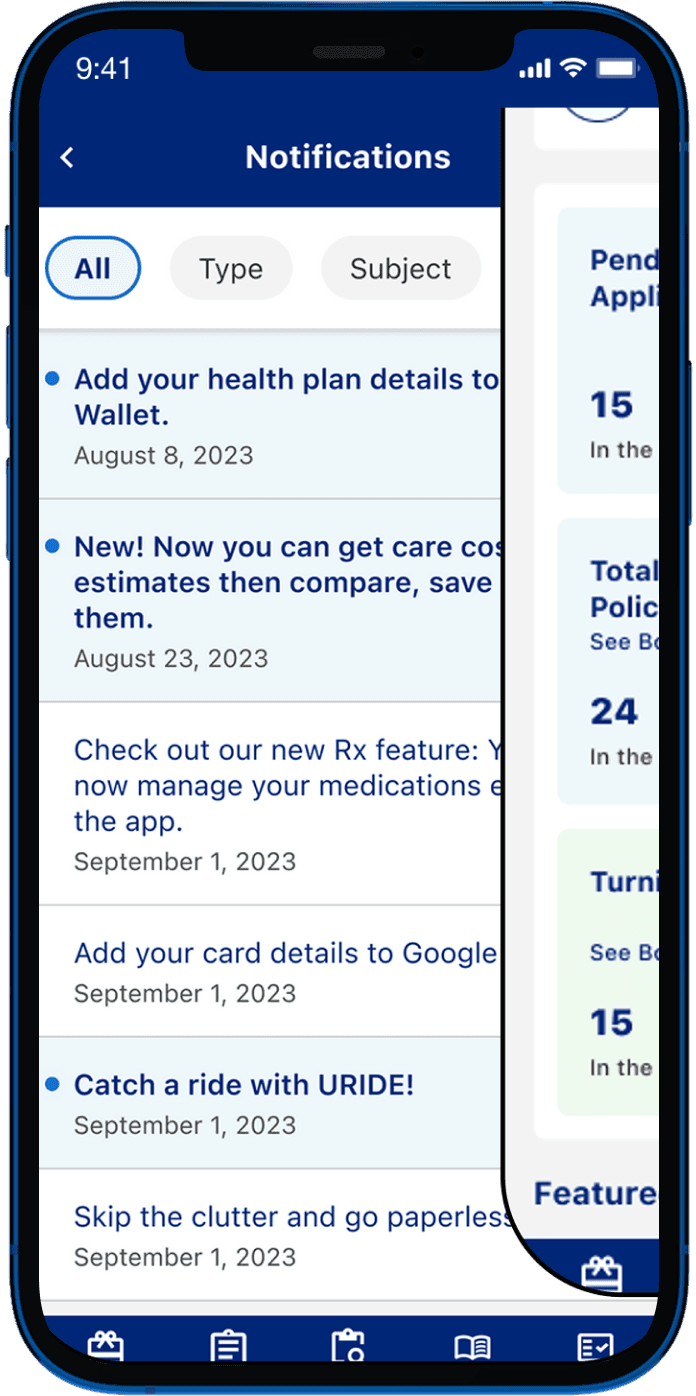
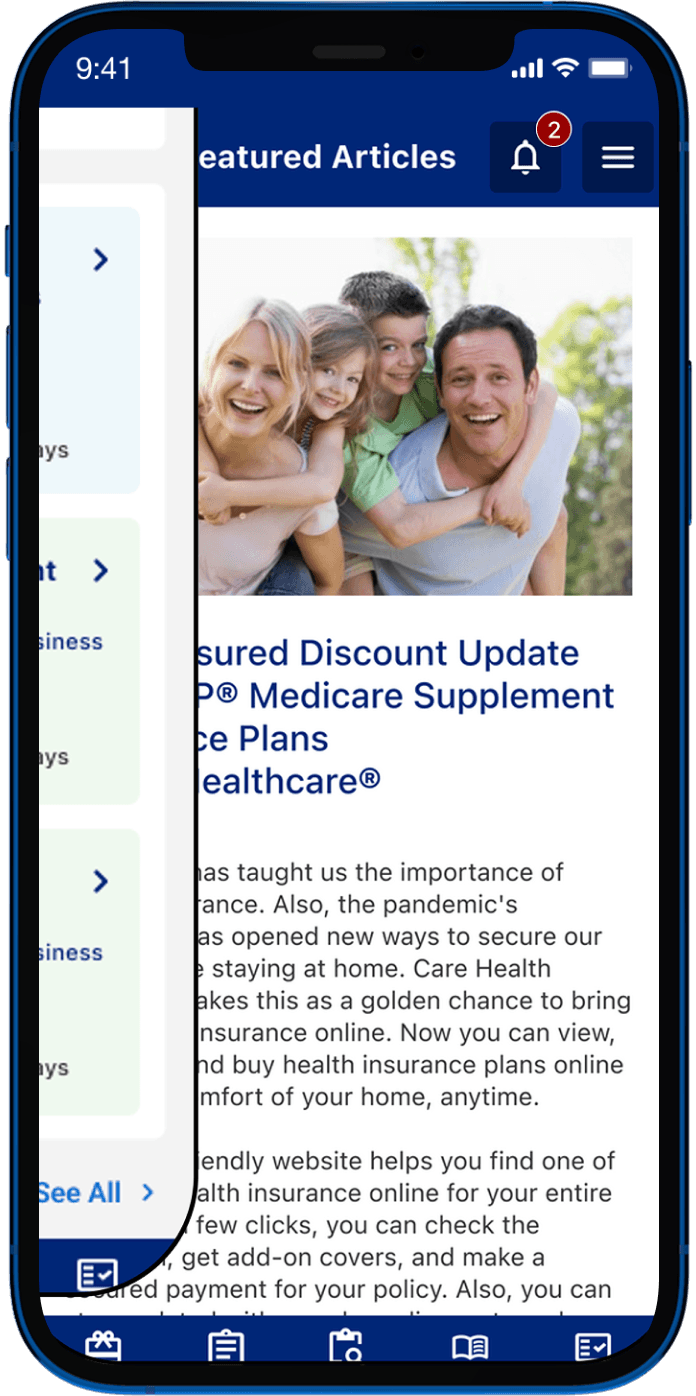
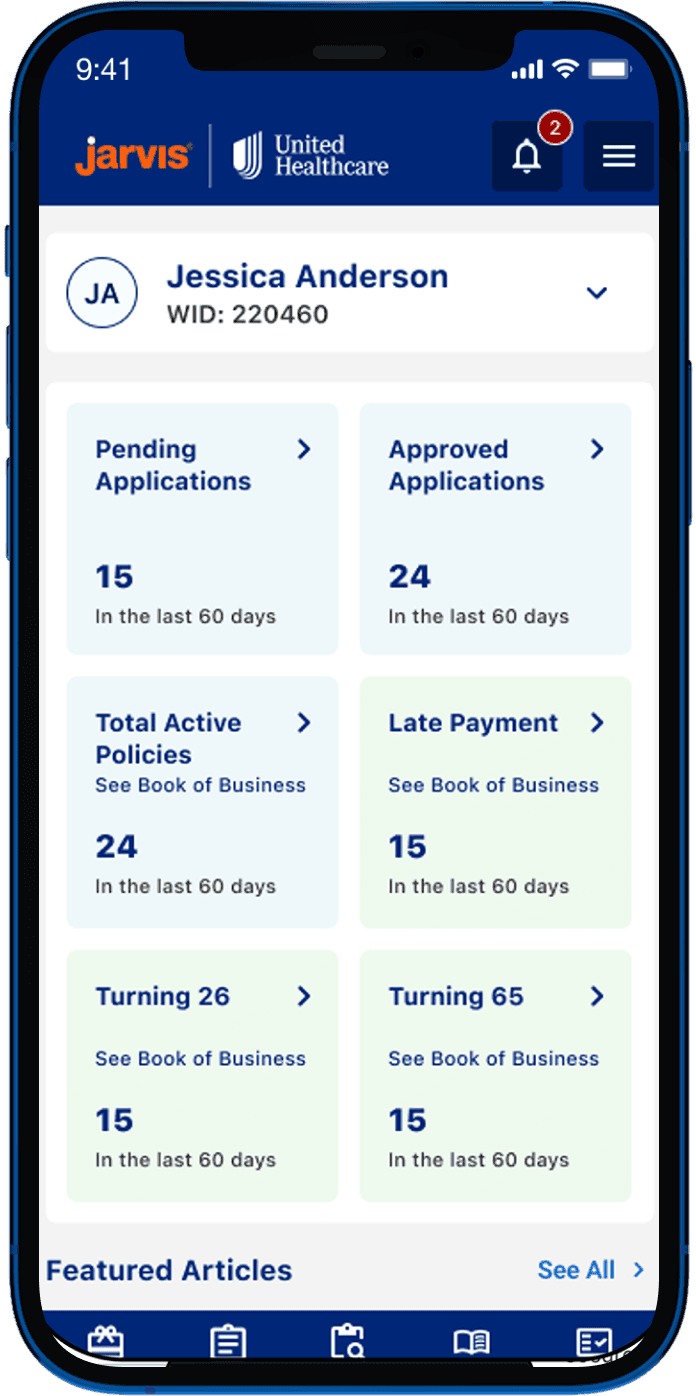
As a Product Designer at an Indian consultancy, I worked on a 1.5-year project with a leading healthcare insurer. Starting with a UX audit, we rebuilt their incomplete mobile app from scratch with a new IA and new components in the design system.
Client
United Healthcare Group
Duration
18 months
Industry
Healthcare Insurance
Scope of work
App Design
Design System
Information Architecture

Portal-to-App Feature Integration & UX Optimization.
We set out to bring portal-level depth into a mobile-first experience, translating core functionalities and features without losing fidelity, and delivering a cohesive, brand-aligned experience across mobile and tablet.
UX Audit
We conducted a comprehensive UX audit of UHC’s legacy application using established usability principles and NN Group methodologies. The analysis identified key friction points impacting navigation, task completion, and overall user efficiency, leading to four critical areas of improvement.




01 · RESTRUCTURING INFORMATION ARCHITECTURE
"I know this feature exists somewhere, I just never know which menu it's hiding in."
Observation - Navigation logs showed staff taking 4 to 6 steps to reach screens that should have been 2 taps away.
Hypothesis - Reorganising the app around how staff think about their work, rather than how the system stores data, would get them to the right place faster.
What We Did
Ran remote card sorting sessions to map how staff naturally grouped features
Reorganised 40+ screens into 5 task-based groups
Cut navigation depth by 50% for the most frequent journeys
Validated with tree testing before moving to wireframes



02 · Lack of Visual & Interaction Consistency.
"The same action looks completely different on three different screens. Users won't trust it does the same thing."
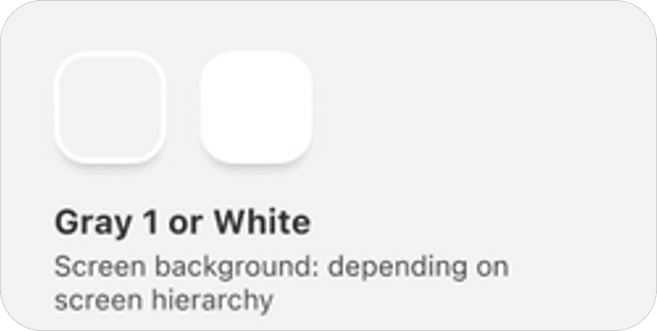
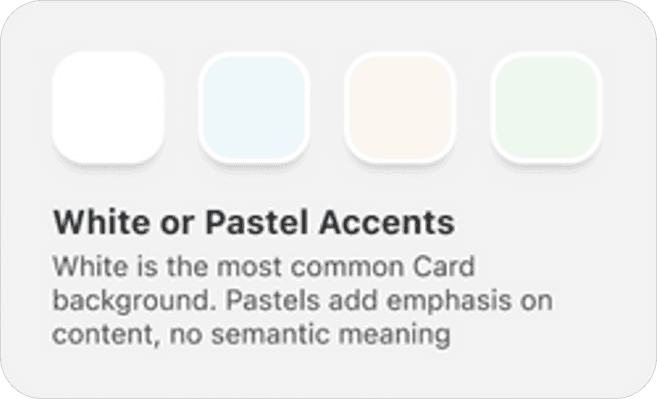
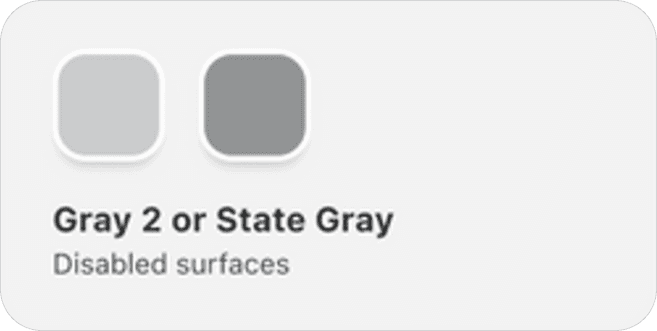
Observation - The audit revealed UHG had an established design system but no mobile-specific components. Without them, developers were defaulting to their own solutions, resulting in UI elements that varied from screen to screen with no mobile consideration.
Hypothesis - Building a mobile component library on top of the existing system would give the team a consistent foundation and remove the guesswork from development.
What We Did
Audited the existing design system to understand tokens and patterns already in place
Built mobile-specific components extending the system, not replacing it
Covered buttons, form fields, cards, navigation elements and interaction states
Documented each component so the US dev team could reference them independently
03 · High Cognitive Load in Forms.
"I always lose track of what I've already filled in."
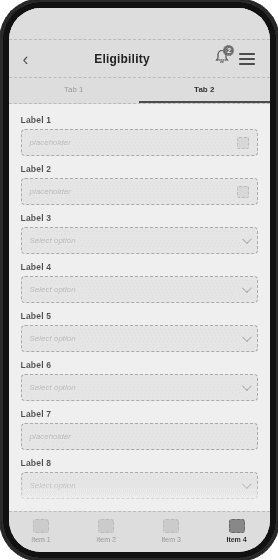
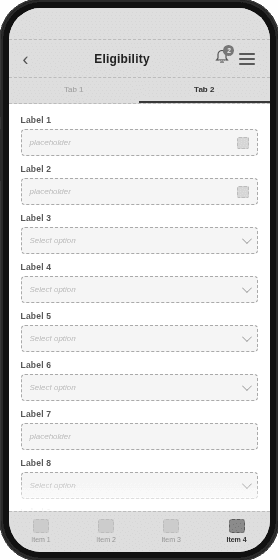
Observation - Drop-off data from the product analyst flagged enrollment and claims forms as the biggest problem areas. Multi-column layouts designed for desktop were forcing mobile users to scroll both horizontally and vertically, breaking reading flow.
Hypothesis - Mobile users process information linearly. Forcing a multi-column structure on a small screen creates unnecessary cognitive load that compounds with form length.
What We Did
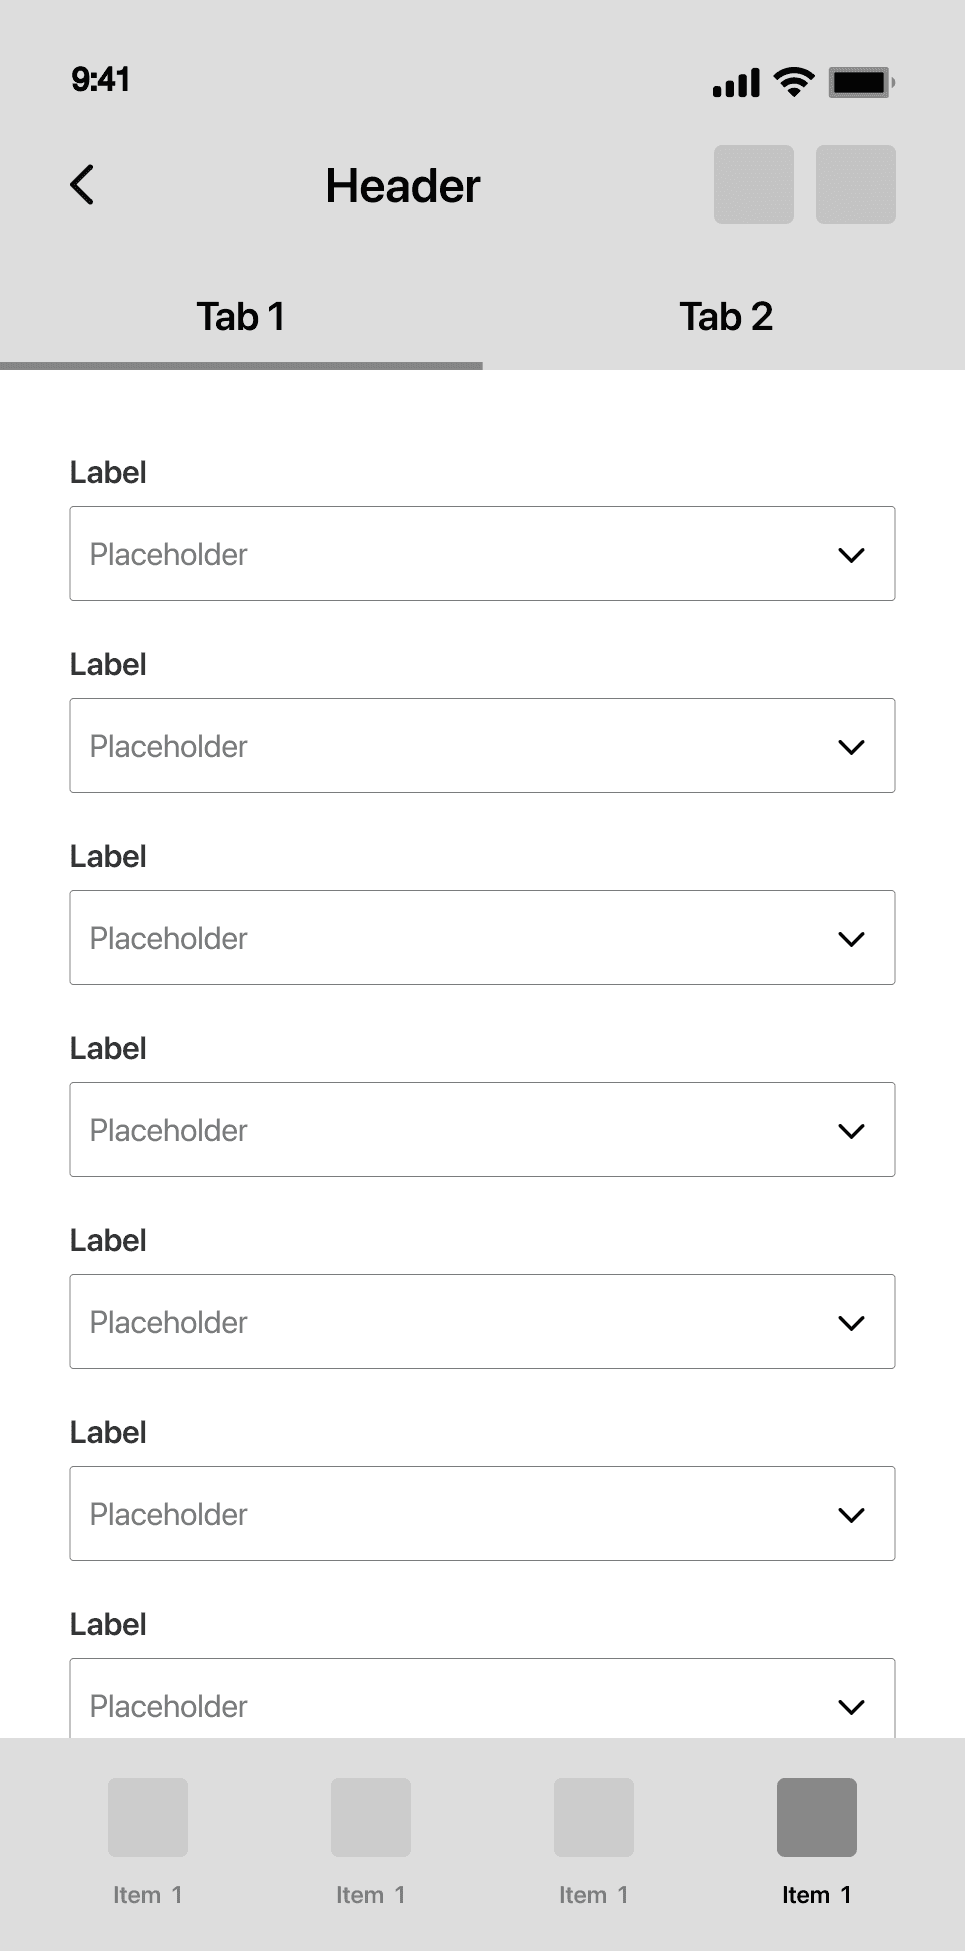
Moved from multi-column to single-column layout, eliminating horizontal scroll entirely
Broke forms into labelled steps with a persistent progress indicator
Added inline validation so errors surfaced immediately, not on submission
04 · Simplifying Navigation Hierarchy
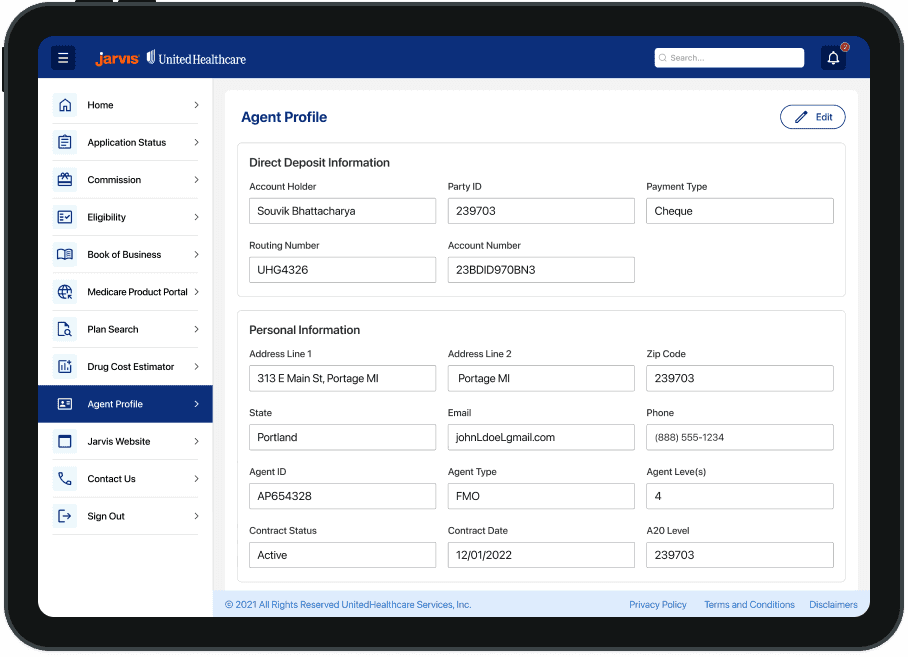
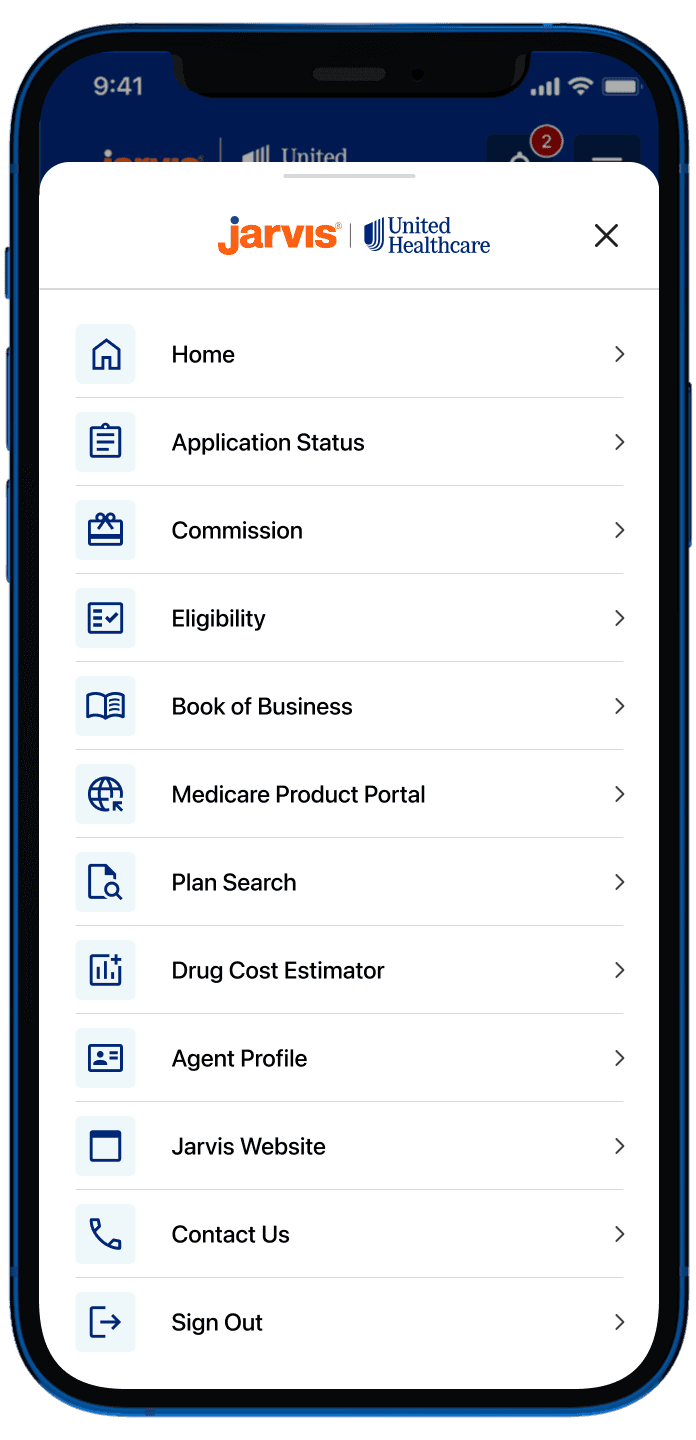
Observation - Key features were duplicated across the homepage, navigation bar and hamburger menu with no clear logic or order. There were no shared criteria for what belonged where, and it was creating friction both for users and between teams.
Hypothesis - Navigation placement driven by real usage data rather than team opinion would create a structure that was logical for users and defensible to stakeholders.
What We Did
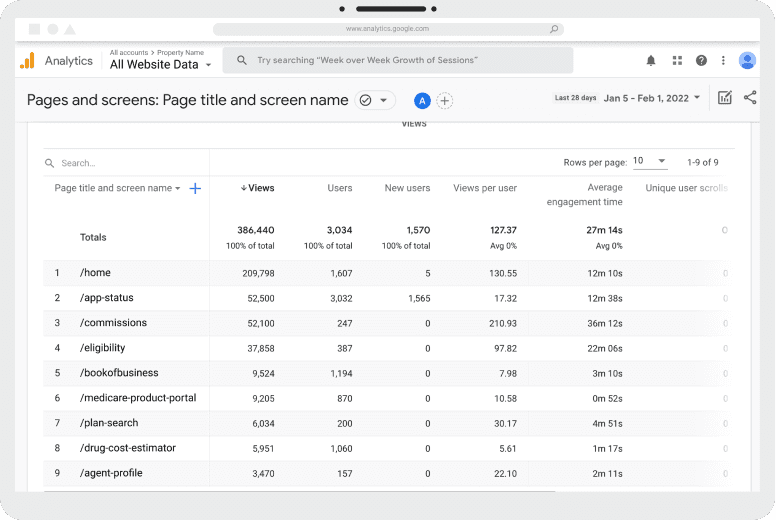
Pulled Google Analytics and Firebase data to identify the most frequently accessed features
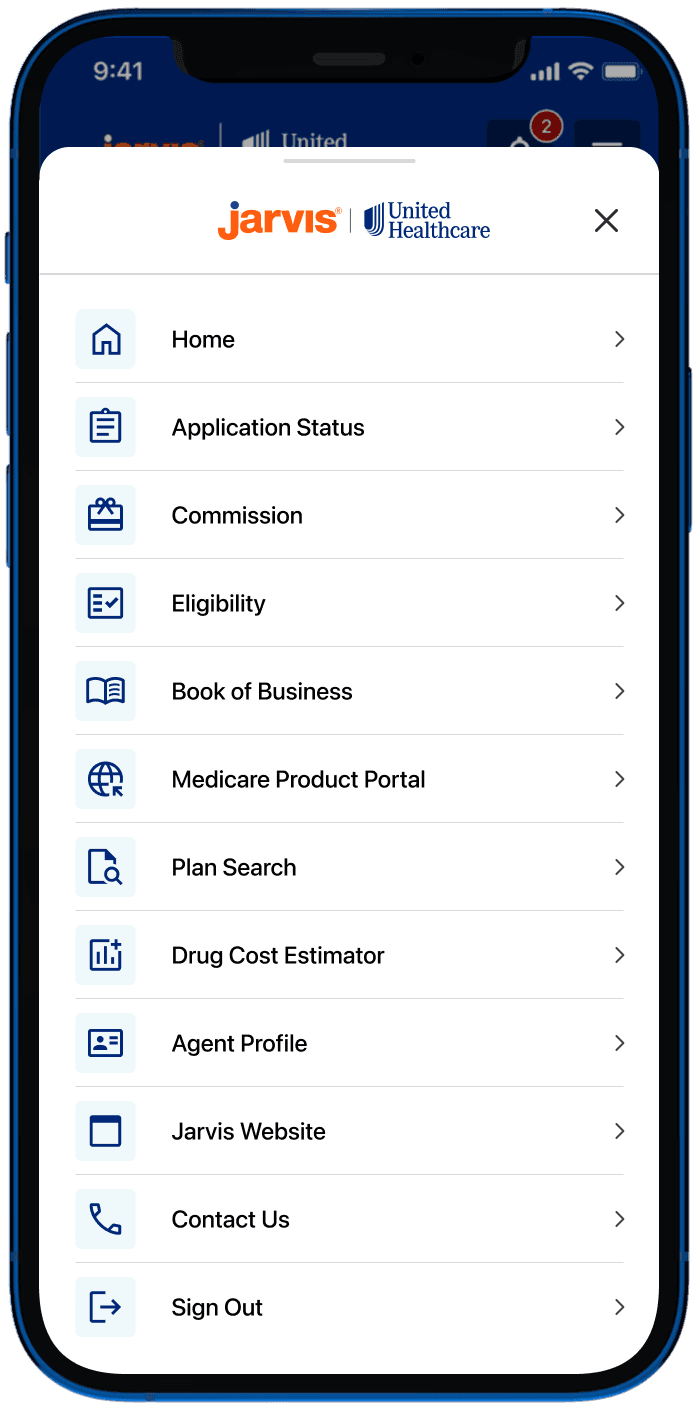
Placed the top four features in the bottom navigation bar for persistent, one-tap access
Moved remaining features into the hamburger menu, ordered by usage from most to least
05 · Limited Findability & Discovery.
"It takes me longer to find the record than to actually do the work."
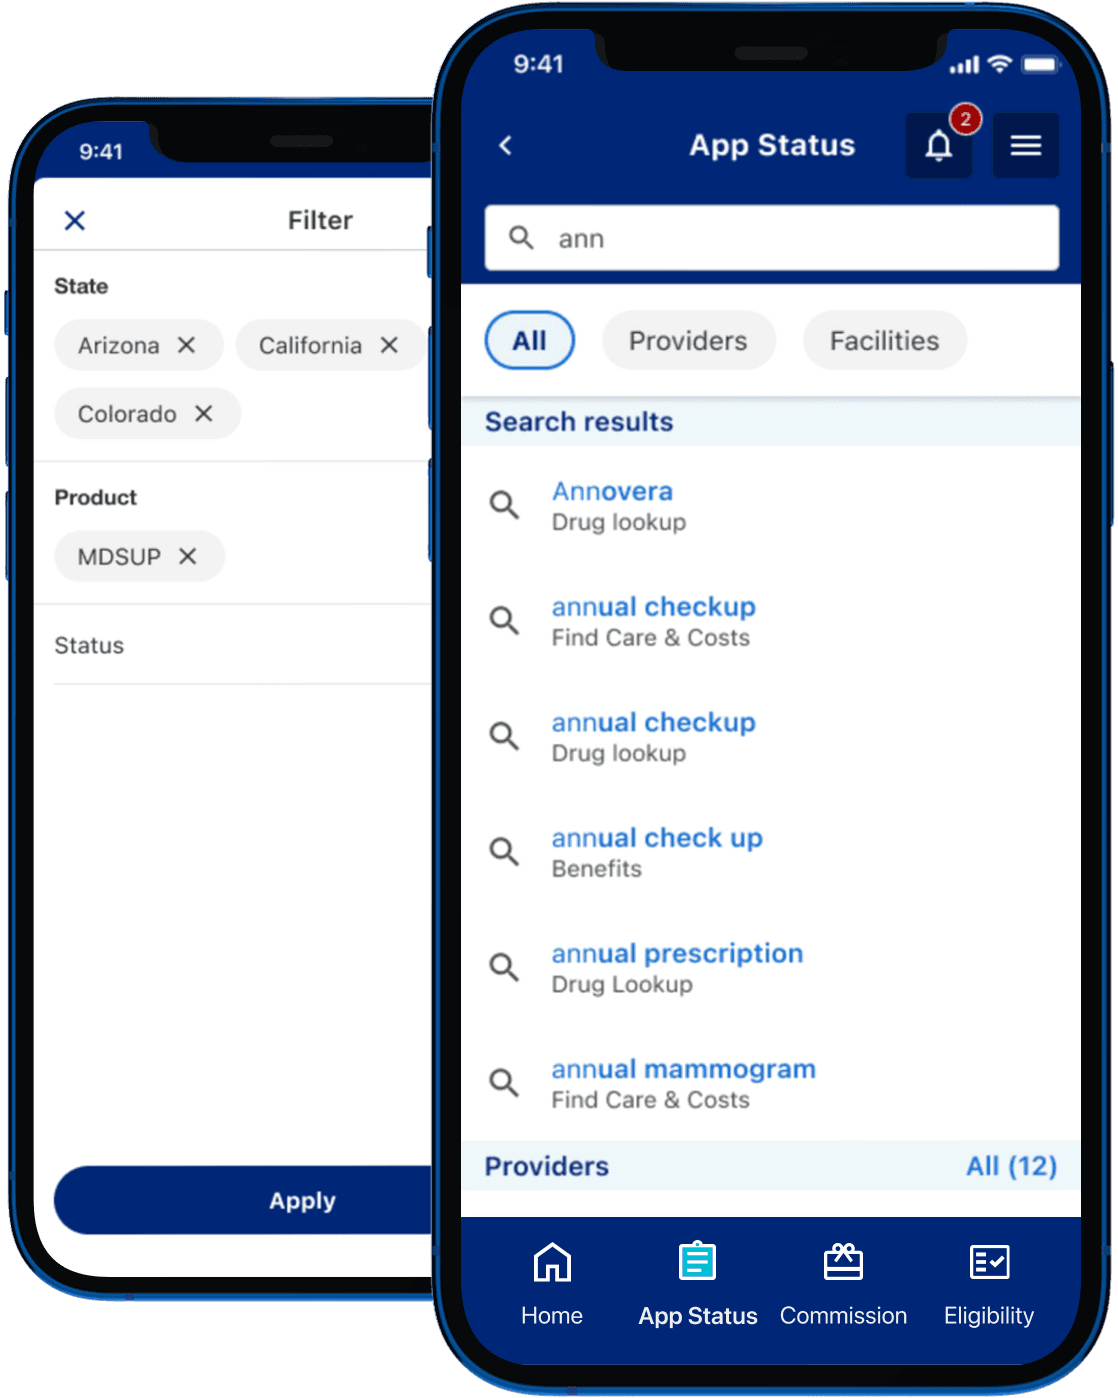
Observation - The app had large data tables but no usable search, filtering or sorting. Users had no way to narrow down what they were looking at, making it difficult to find specific records or take action quickly.
Hypothesis - Introducing search with autocomplete alongside contextual filters, built around the variables users actually care about, would significantly reduce the time spent hunting through data.
What We Did
Ran workshops with different teams to identify the key variables and filters relevant to each dataset.
Introduced search with autocomplete suggestions scoped to relevant content types
Designed filter states that persisted so users did not lose context when switching views
Improved ADA/WCAG compliance scores – Adobe Colour Contrast Analyzer
Higher portal/app logins and active users – Google Analytics
Increased mobile and cross-platform usage – Google Analytics