
Member Portal
Redesigned a mobile app for insurance agents, now with 5M+ downloads on Google Play.
As a Product Designer at an Indian consultancy, I worked on a 1.5-year project with a leading healthcare insurer. Starting with a UX audit, we rebuilt their incomplete mobile app from scratch with a new IA and new components in the design system.
Client
United Healthcare Group
Duration
18 months
Industry
Healthcare Insurance
Scope of Work
App Design
Information Architecture
Design System
Challenge
Closing the Gap Between Portal and Mobile
The client's insurance agents work in the field, not at a desk, and had decided to make mobile their main channel. But the app was still missing features the legacy web portal had, so agents kept getting pulled back to desktop. Closing that gap is why I was brought on.
Users Leaving Mid-Task
Mobile drop-off ran well above what the portal saw for the same actions.Support Absorbing the Overflow
Over 15,000 calls a month came from members who got stuck on the app.Half the Portal Wasn't on Mobile Yet
Several web portal features hadn't made it into the app, so agents had to switch back to desktop to finish the task.
Discovery
UX Audit & Key Findings
Before touching any screens, I ran a UX audit against NN Group heuristics and cross-checked it with two quarters of analytics and support ticket data. Four patterns kept showing up, and each one was quietly costing the business money.
01
Complex Navigation
"I know this feature exists somewhere, I just never know which menu it's hiding in." — Product Analyst
Users took 4 to 6 taps to reach screens that should've taken 2. Every extra tap meant more people abandoning the task, and abandoned tasks were flowing straight into support call volume.text

01
Complex Navigation
"I know this feature exists somewhere, I just never know which menu it's hiding in." — Product Analyst
Users took 4 to 6 taps to reach screens that should've taken 2. Every extra tap meant more people abandoning the task, and abandoned tasks were flowing straight into support call volume.text
02
Unclear Call-to-Action
"I wasn't sure if tapping that would submit my claim or just save it." — Insurance Agent
About 3 in 5 users hesitated or picked the wrong action on core screens during user interviews. Second-guessing what a button does slows every client interaction and erodes trust in the tool itself.

02
Unclear Call-to-Action
"I wasn't sure if tapping that would submit my claim or just save it." — Insurance Agent
About 3 in 5 users hesitated or picked the wrong action on core screens during user interviews. Second-guessing what a button does slows every client interaction and erodes trust in the tool itself.
03
Complex Form Structures
"On mobile I have to scroll left and right just to fill out one form. I'd rather just do it on desktop where I can see the whole thing at once." — Insurance Agent
Claims and enrollment forms had the highest drop-off in the app, around 40%. Biggest single driver of support calls.

03
Complex Form Structures
"On mobile I have to scroll left and right just to fill out one form. I'd rather just do it on desktop where I can see the whole thing at once." — Insurance Agent
Claims and enrollment forms had the highest drop-off in the app, around 40%. Biggest single driver of support calls.
04
Lack of Search Functionality
"It takes me longer to find the record than to actually do the work." — Support Staff
Finding the right plan took over 90 seconds on average. Instead of finishing on their phone, members gave up and switched to desktop.

04
Lack of Search Functionality
"It takes me longer to find the record than to actually do the work." — Support Staff
Finding the right plan took over 90 seconds on average. Instead of finishing on their phone, members gave up and switched to desktop.
Solution
Solutions Mapped to the Audit Findings
Each fix below responds directly to a finding from the audit. The goal wasn't a redesign for its own sake, it was to solve the specific problems agents were already running into every day.
01 · Restructuring the App’s Information Architecture
Agents struggled to find key functions because the app was using the same information architecture as the desktop portal. I restructured the IA around actual mobile usage patterns and validated the new structure before redesigning the screens.
Solution Highlights
Ran card sorting sessions to see how agents naturally grouped features
Reorganized 40+ screens into 5 task-based groups, cutting navigation depth by half
Validated the new structure with tree testing before wireframing
02 · Setting Navigation Hierarchy from Google Analytics Data
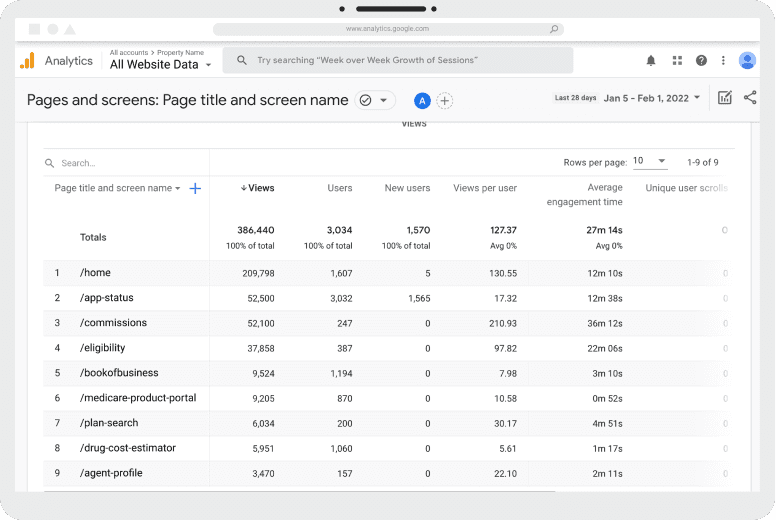
With the new structure in place, I used Google Analytics to determine which features agents accessed most and how they engaged with them, replacing assumptions with usage data.
Solution Highlights
Pulled Google Analytics data on page views and engagement time across the app
Ranked features by actual usage, not internal opinion
Placed the most-used features into the bottom navigation for quicker access.
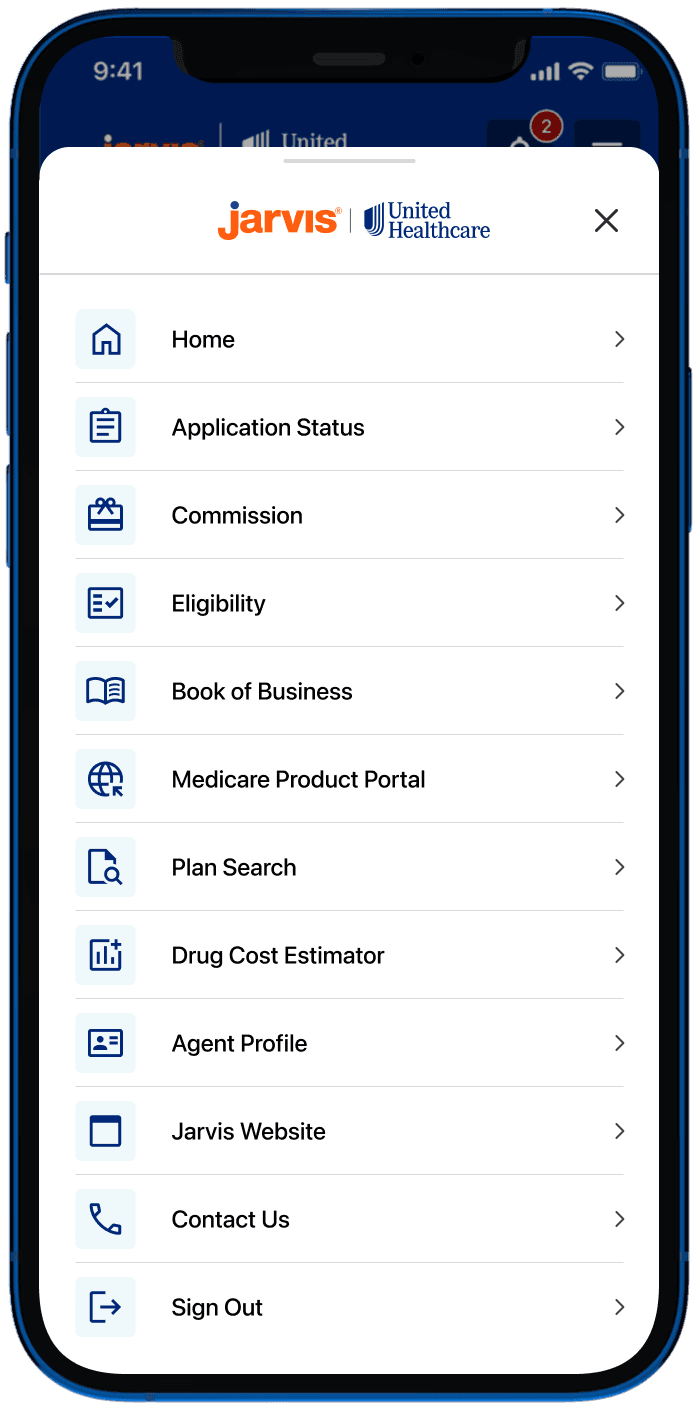
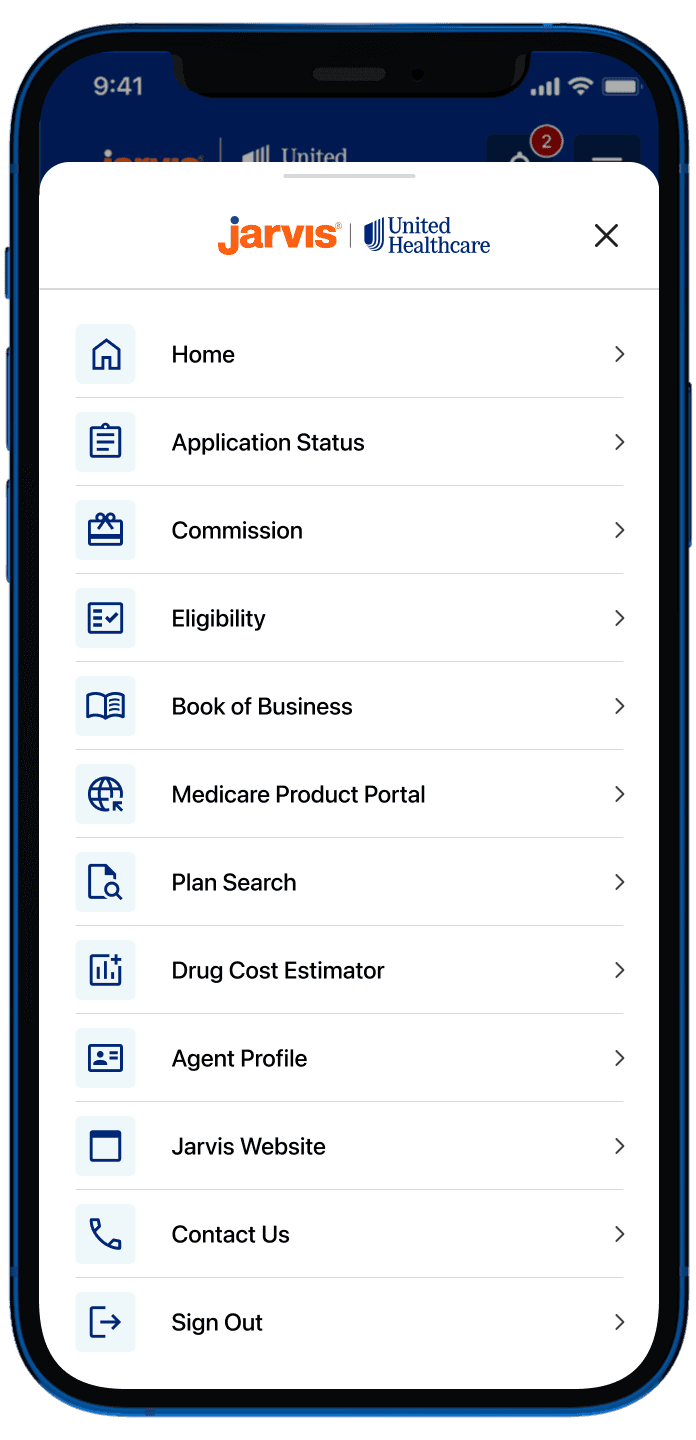
Ordered the hamburger menu to match, most used to least
02 · Setting Navigation Hierarchy from Google Analytics Data
With the new structure in place, I still had to decide what agents saw first. Rather than guess, I pulled Google Analytics data on page views and engagement time and let actual usage set the order.
Solution Highlights
Pulled Google Analytics data on page views and engagement time across the app
Ranked features by actual usage, not internal opinion
Placed the most-used features in the bottom navigation bar for one-tap access
Ordered the hamburger menu to match, most used to least
The most visited pages identified in Google Analytics (left) were used to determine the hierarchy of items in the hamburger menu (right), aligning navigation with real user behavior.
The most visited pages identified in Google Analytics (left) were used to determine the hierarchy of items in the hamburger menu (right), aligning navigation with real user behavior.
The most visited pages identified in Google Analytics (left) were used to determine the hierarchy of items in the hamburger menu (right), aligning navigation with real user behavior.
03 · Extending the Design System with Mobile Components
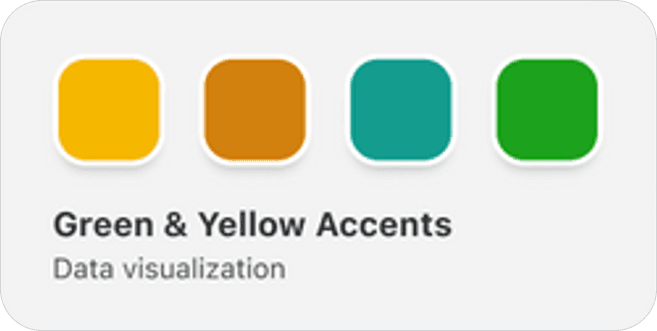
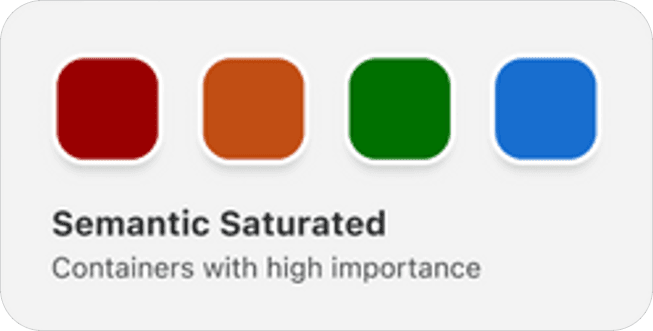
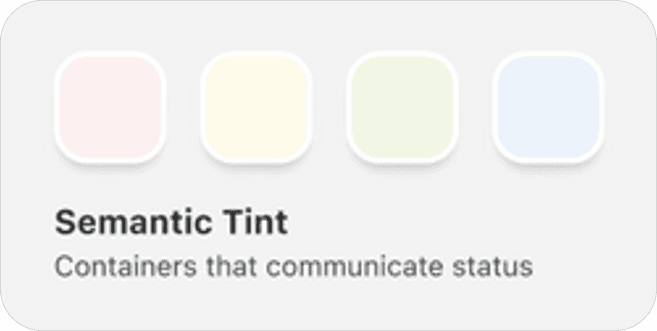
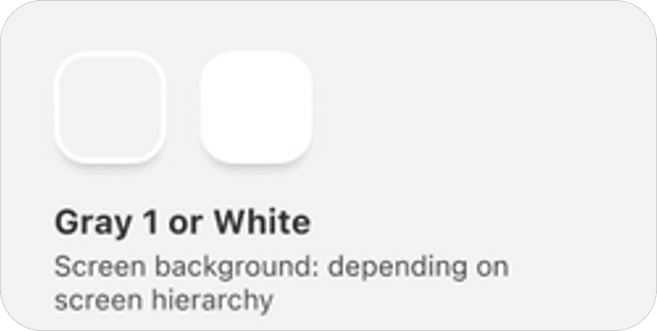
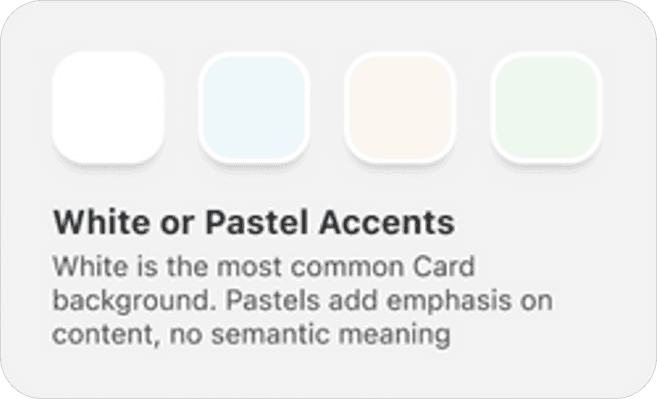
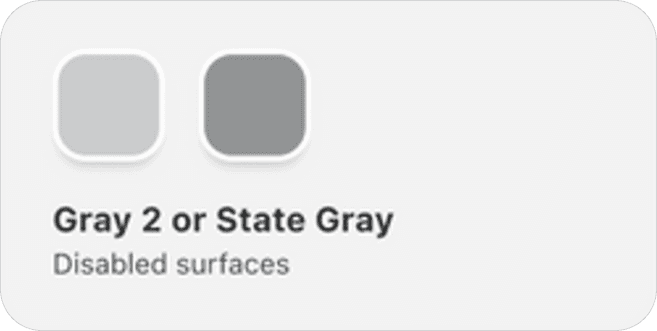
There was no mobile component library, so developers were defaulting to their own solutions screen by screen. I extended the client's existing design system instead of building a new one from scratch.
Solution Highlights
Audited the existing design system to understand tokens and patterns already in place
Built mobile-specific components while preserving the existing design language
Standardized forms, cards, navigation, interaction states, and CTA patterns


04 · Turning Long Forms Into Guided Steps
Forms were a core part of the application, and research showed that their complexity was one of the reasons agents avoided completing these tasks on mobile. I redesigned the form experience around shorter, guided steps to make frequent workflows easier to complete on a phone.
Solution Highlights
Switched to single-column layouts, removing horizontal scroll entirely
Broke long forms into labeled steps with a visible progress indicator
Designed immediate success and error feedback instead of post-submission validation.

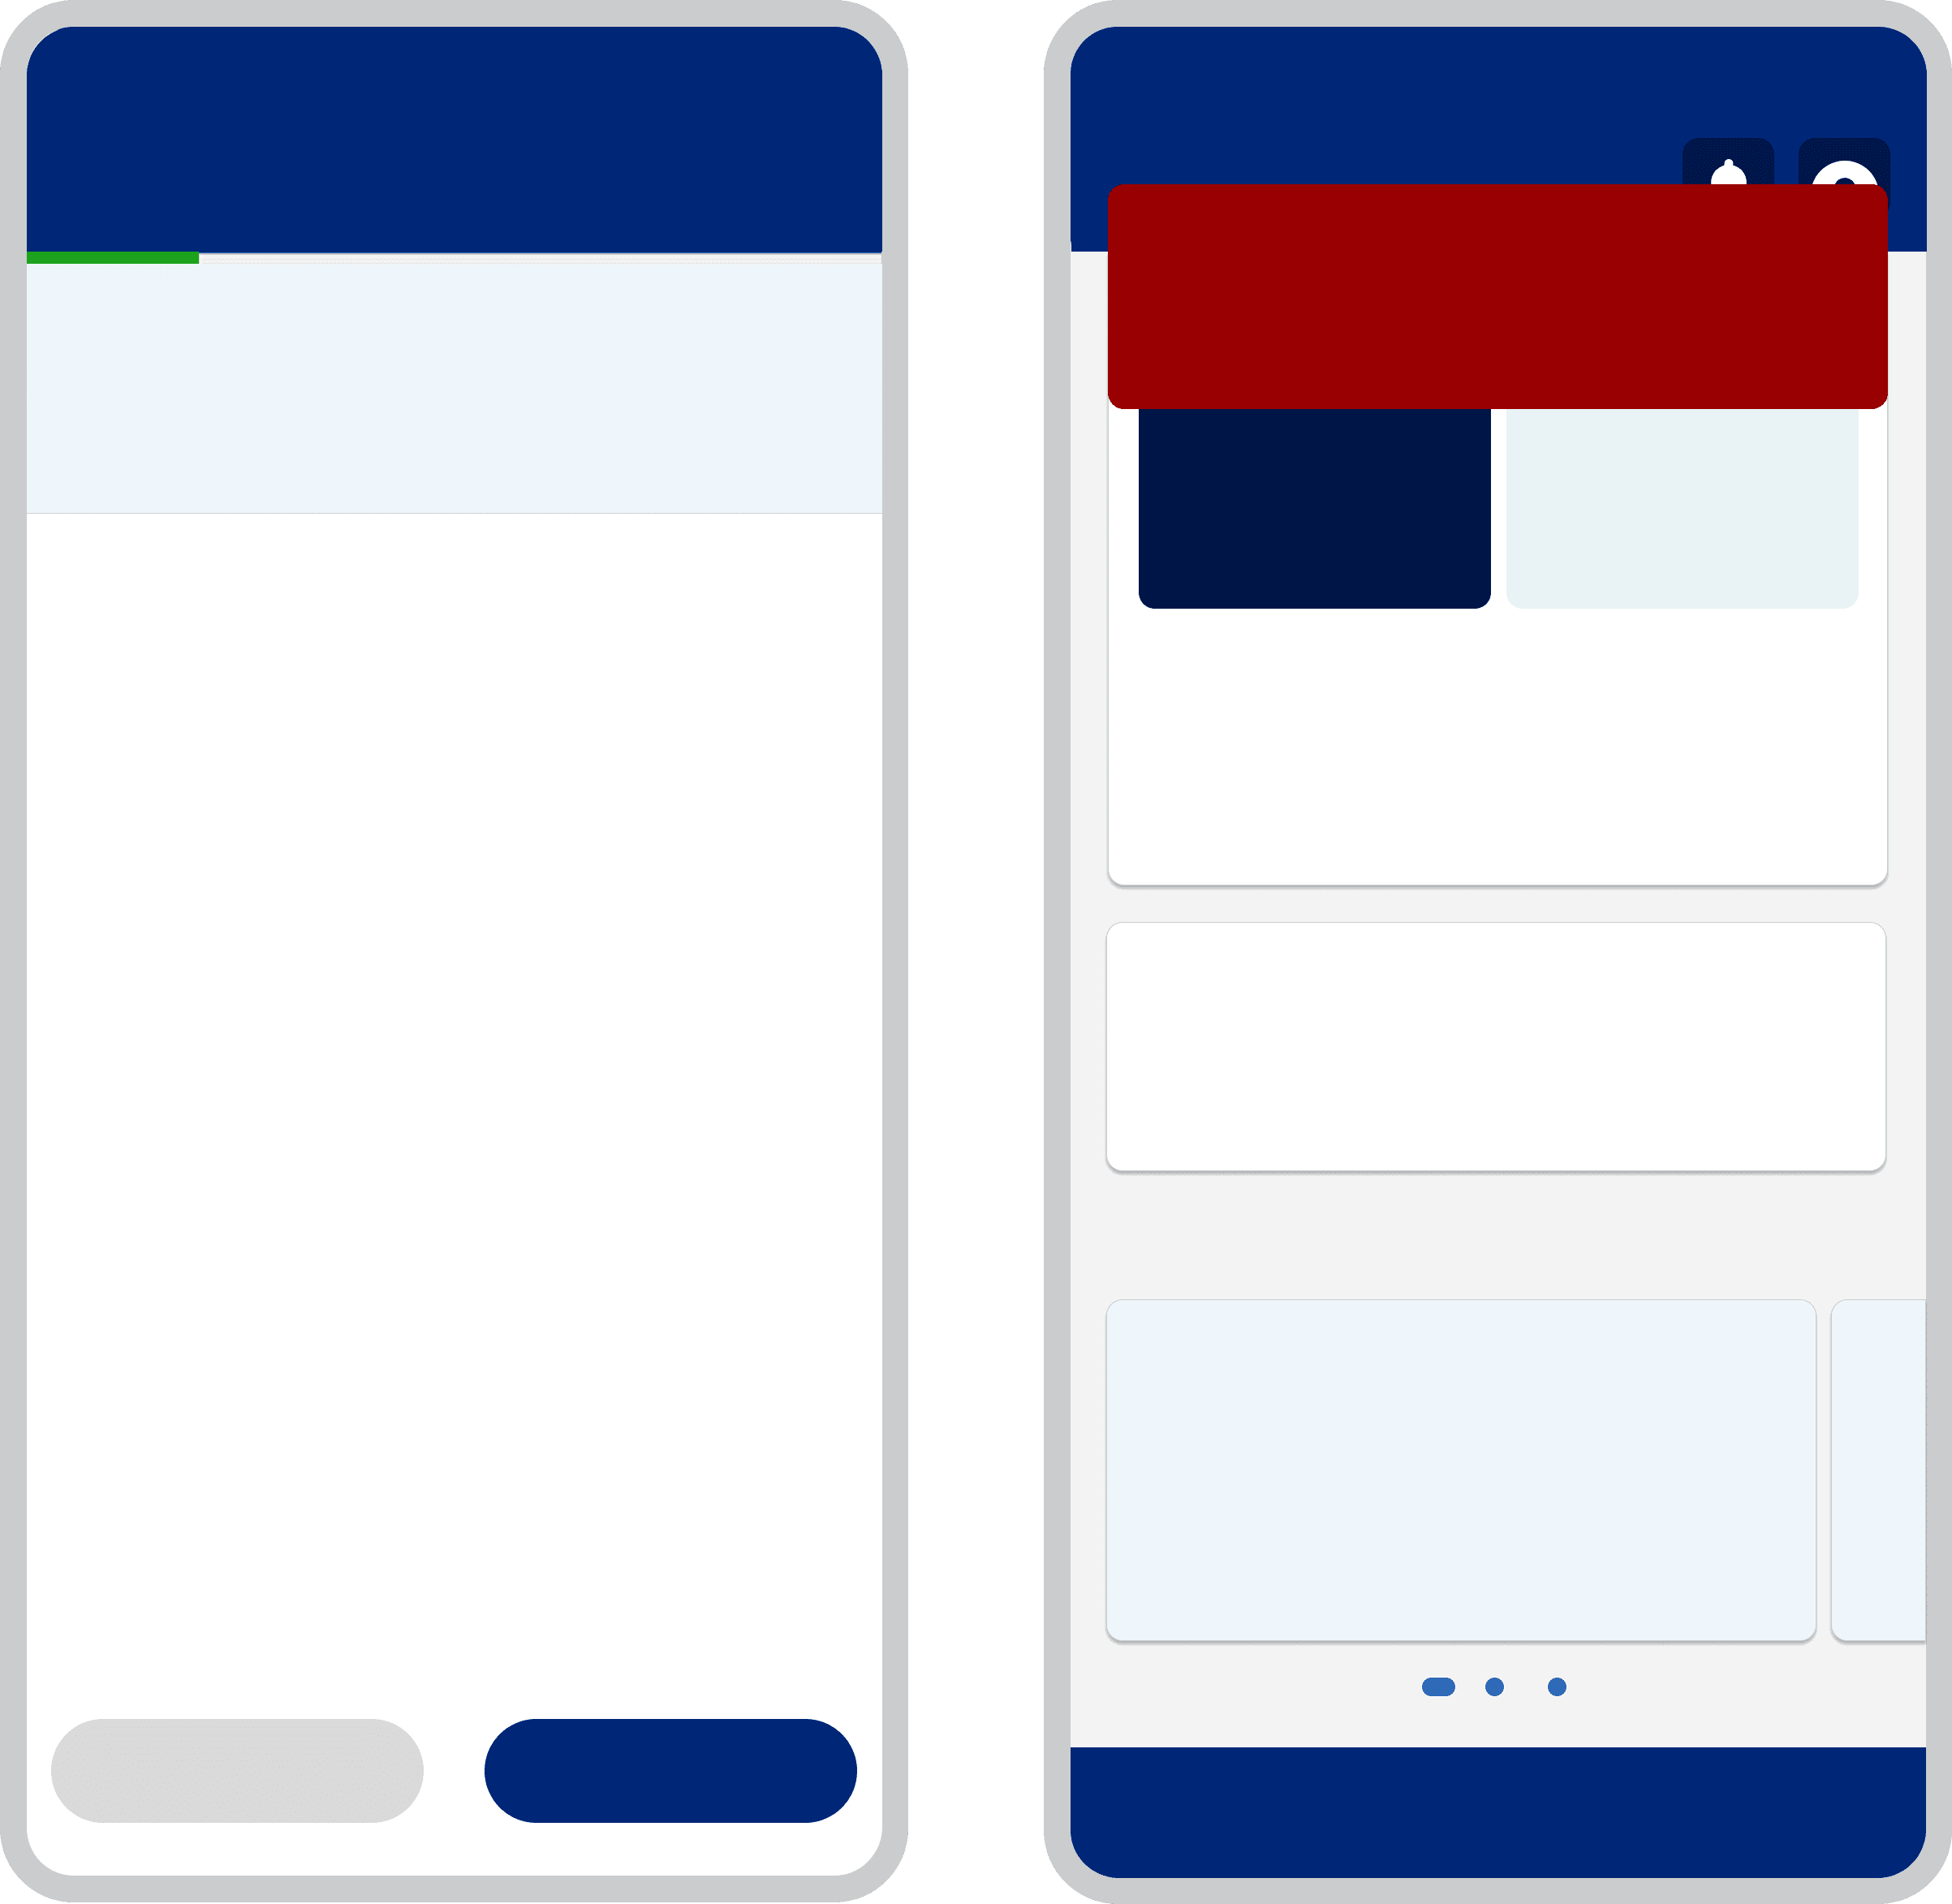
Wireframes were initially developed to align the team on the application's structure and user flow. These were then evolved into interactive prototypes that communicated transition states and user interactions, enabling consistent implementation by developers.
Wireframes were initially developed to align the team on the application's structure and user flow. These were then evolved into interactive prototypes that communicated transition states and user interactions, enabling consistent implementation by developers.
Wireframes were initially developed to align the team on the application's structure and user flow. These were then evolved into interactive prototypes that communicated transition states and user interactions, enabling consistent implementation by developers.
05 · Defining Search & Filtering Through a Stakeholder Workshops
Search and filtering emerged as key requirements, but defining the right experience required alignment across user needs, business priorities, and technical feasibility. I used stakeholder workshops to bring these perspectives together and define the functionality.
Solution Highlights
Identified where search, filtering, and sorting were needed across key workflows
Defined the relevant filtering and sorting parameters, while aligning them with technical feasibility
Defined filter chip behavior, multi-select patterns, and clear/reset interactions
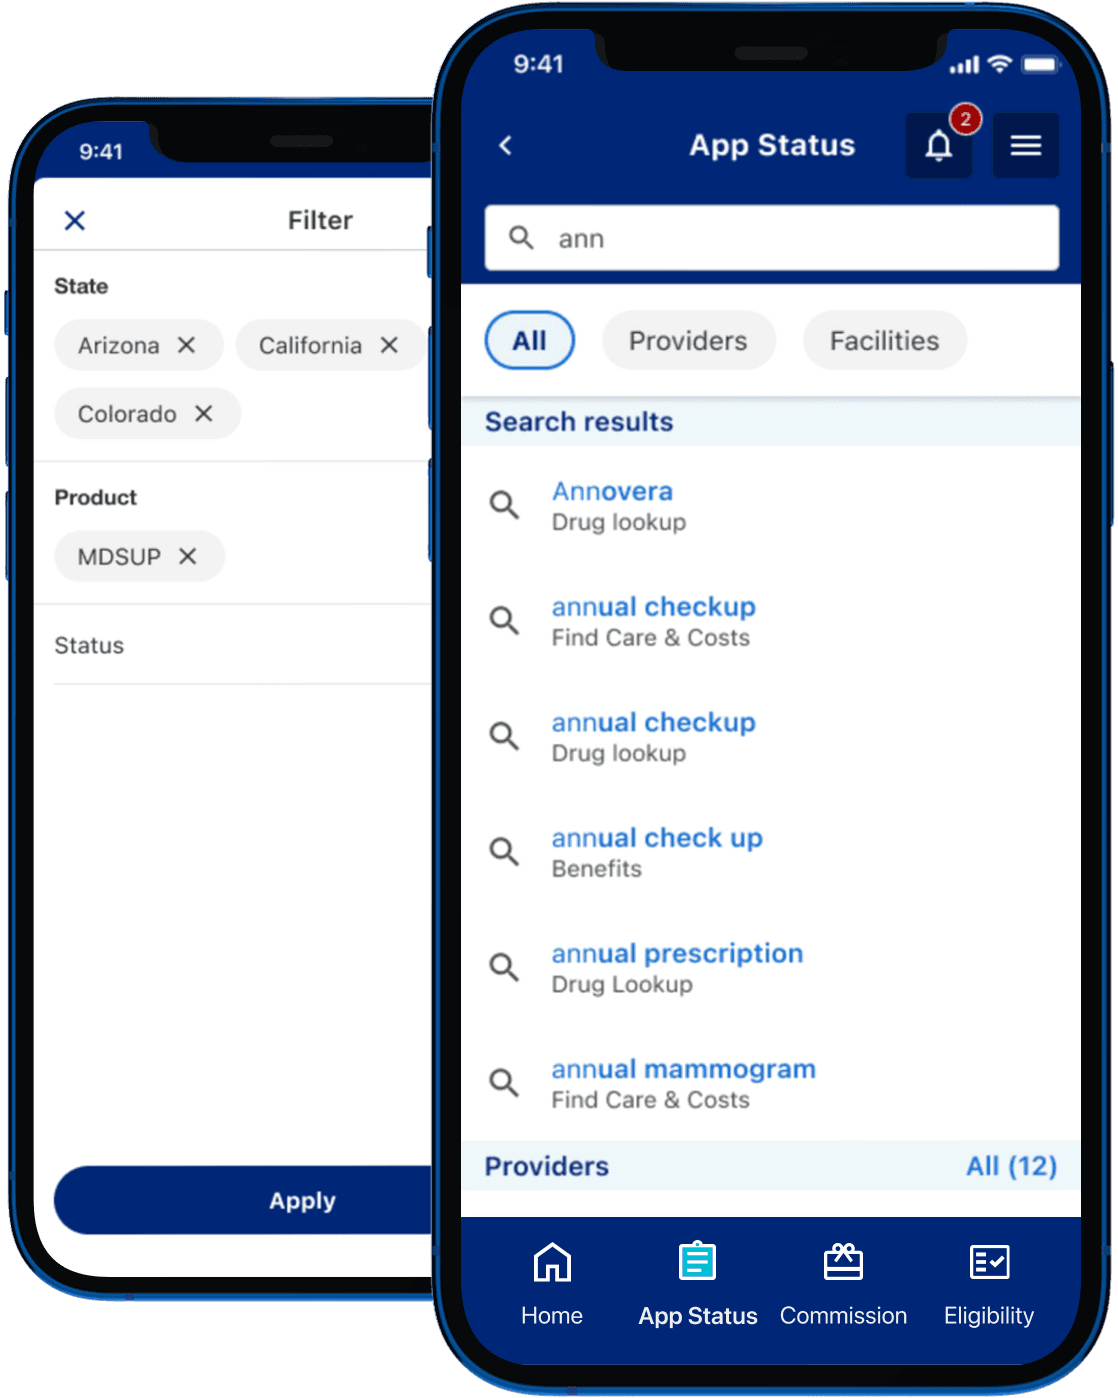

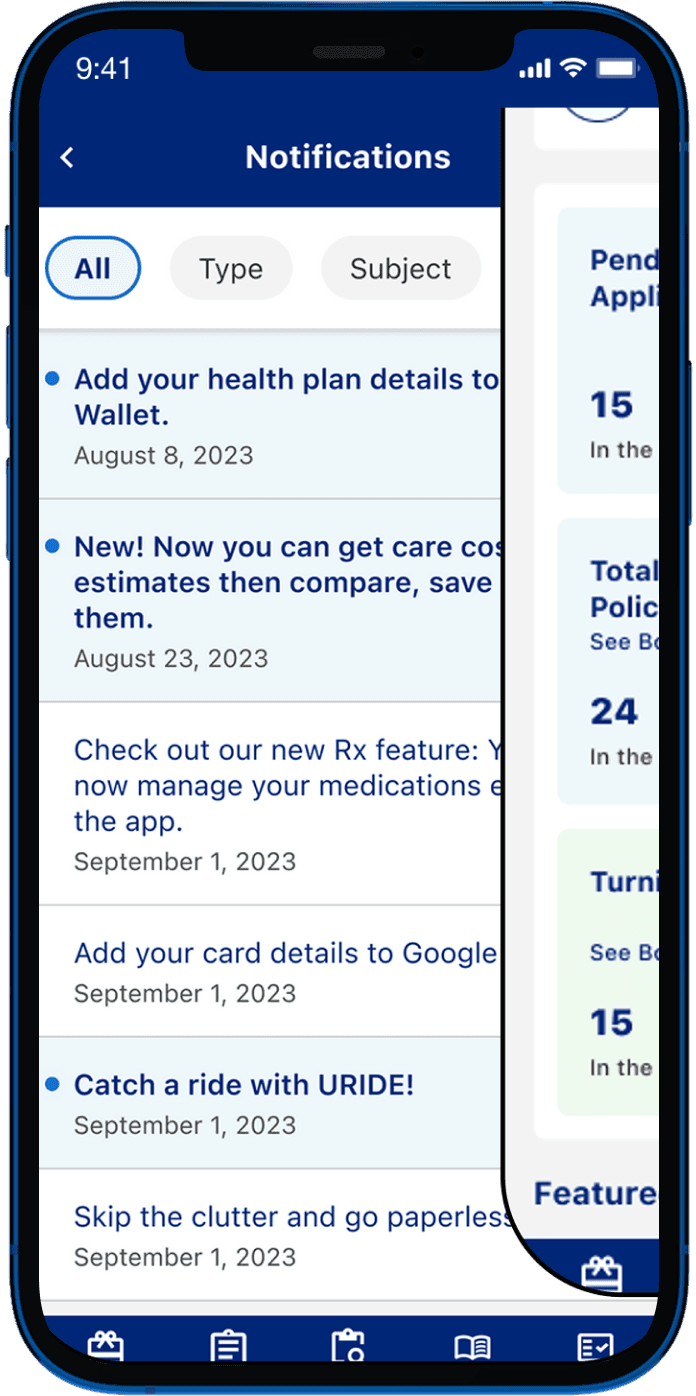
Stakeholder workshops for the Application Status page defined the search, filtering, and sorting experience, which was translated into the final UI shown on the right.
Stakeholder workshops for the Application Status page defined the search, filtering, and sorting experience, which was translated into the final UI shown on the right.
Impact
Measurable Business & User Impact
Impact
Measurable Business & User Impact

Higher User Engagement
Mobile app usage increased by 12% within the first month, with more insurance agents choosing the mobile app as part of their daily workflow.
Validated using: Google Analytics
Higher User Engagement
Mobile app usage increased by 12% within the first month, with more insurance agents choosing the mobile app as part of their daily workflow.
Validated using: Google Analytics

Improved Accessibility
Lighthouse Accessibility Score improved from 68 to 91, reflecting a more accessible and inclusive experience across the redesigned member portal.
Validated using: Lighthouse, Axe & manual accessibility testing
Improved Accessibility
Lighthouse Accessibility Score improved from 68 to 91, reflecting a more accessible and inclusive experience across the redesigned member portal.
Validated using: Lighthouse, Axe & manual accessibility testing
Faster Task Completion
Task completion time improved by 24% during usability testing, with simplified navigation and fewer interaction steps reducing the time required.
Validated using: Moderated usability testing
Faster Task Completion
Task completion time improved by 24% during usability testing, with simplified navigation and fewer interaction steps reducing the time required.
Validated using: Moderated usability testing
Reflection
What This Project Taught Me
Beyond improving accessibility and responsiveness, these are three lessons I'll carry into future projects.
01 · Design Decisions Need Evidence
Working on this project changed how I approach product decisions. During the redesign, different stakeholders had different views on which features should appear in the bottom navigation and the hamburger menu. Rather than relying on opinions, we used product analytics to understand which features users accessed most frequently and structured the navigation around actual behaviour. It reinforced that analytics isn't just a reporting tool, it's an essential input for UX decision-making.
02 · Platform Shapes Information Architecture
When I joined the project, the mobile experience was based on the same information architecture as the web portal. The same structure that worked well on desktop created unnecessary complexity on mobile. Designing around the mobile context resulted in a simpler navigation model and quicker access to frequently used features.
03 · Alignment Is Part of the Design Process
Adding search, filtering and sorting seemed straightforward until business expectations and technical constraints diverged. Running collaborative stakeholder workshops helped us prioritise features that delivered the most value while remaining technically feasible. It changed how I think about design. It's not just about creating interfaces, but also about aligning people around practical solutions.
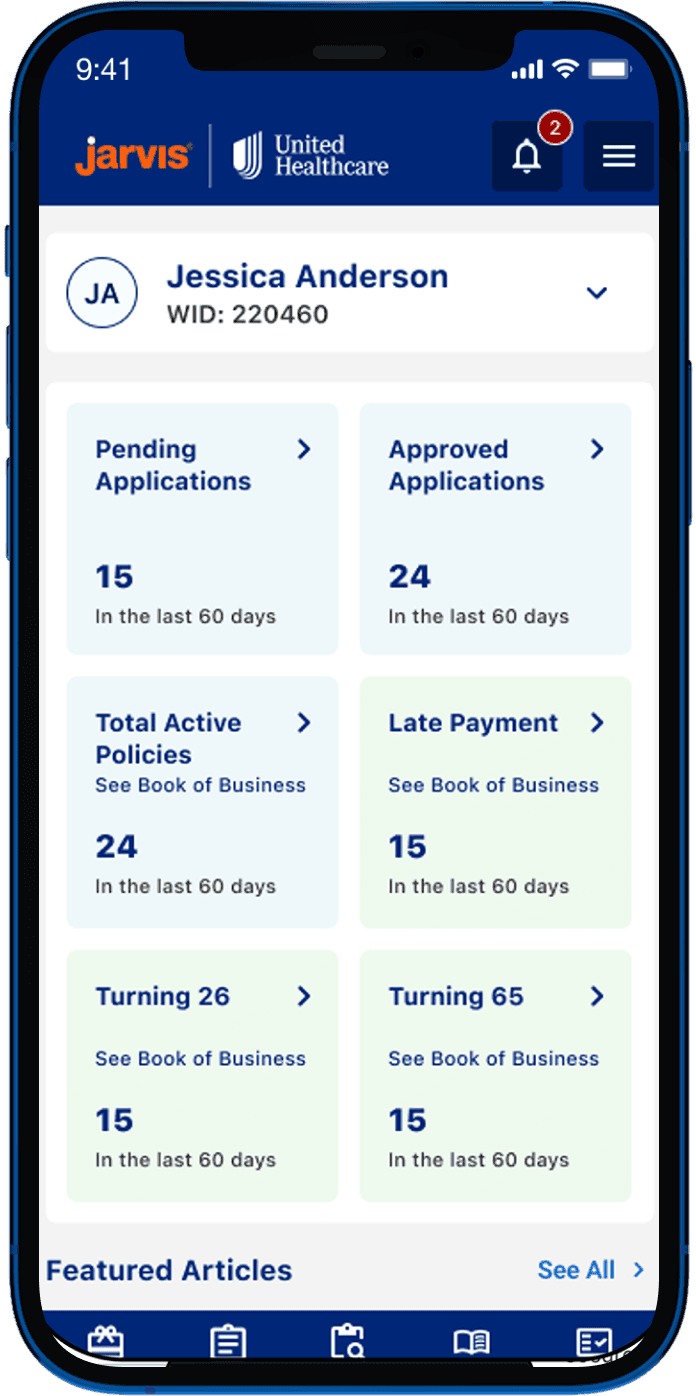
Explore Other Client Projects



Member Portal
As a Product Designer at an Indian consultancy, I worked on a 1.5-year project with a leading healthcare insurer. Starting with a UX audit, we rebuilt their incomplete mobile app from scratch with a new IA and new components in the design system.
Insurance in the Digital Era
Client
United Healthcare Group
Duration
18 months
Industry
Healthcare Insurance
Scope of work
App Design
Design System
Information Architecture
01 · Fixing the App's Information Architecture
Agents couldn't find things because the app was still running on the same information architecture as the web portal, a structure built for a desktop screen where everything is visible at once, not a phone. I rebuilt the IA from scratch based on real usage patterns.
Solution Highlights
Ran card sorting sessions to see how agents naturally grouped features
Reorganized 40+ screens into 5 task-based groups, cutting navigation depth by half
Validated the new structure with tree testing before wireframing
Reflection
What This Project Taught Me
Beyond improving accessibility and responsiveness, these are three lessons I'll carry into future projects.
01 · Design Decisions Need Evidence
Working on this project changed how I approach product decisions. During the redesign, different stakeholders had different views on which features should appear in the bottom navigation and the hamburger menu. Rather than relying on opinions, we used product analytics to understand which features users accessed most frequently and structured the navigation around actual behaviour. It reinforced that analytics isn't just a reporting tool, it's an essential input for UX decision-making.
02 · Platform Shapes Information Architecture
When I joined the project, the mobile experience was based on the same information architecture as the web portal. The same structure that worked well on desktop created unnecessary complexity on mobile. Designing around the mobile context resulted in a simpler navigation model and quicker access to frequently used features.
03 · Alignment Is Part of the Design Process
Adding search, filtering and sorting seemed straightforward until business expectations and technical constraints diverged. Running collaborative stakeholder workshops helped us prioritise features that delivered the most value while remaining technically feasible. It changed how I think about design. It's not just about creating interfaces, but also about aligning people around practical solutions.
05 · Introduced Search & Filtering to Improve Data Discovery
Finding the right claims data or check application took over 90 seconds, so agents gave up and switched back to desktop. There was no way to search or narrow down long lists.
Solution Highlights
Defined search and filter categories based on business workflows and stakeholder requirements.
Designed clear empty, loading, and no-results states for search experiences.
Defined filter chip behavior, multi-select patterns, and clear/reset interactions.
Stakeholder workshops for the Application Status page defined the search, filtering, and sorting experience, which was translated into the final UI shown on the right.
Challenge
Closing the Gap Between Portal and Mobile
The client's insurance agents work in the field, not at a desk, and had decided to make mobile their main channel. But the app was still missing features the legacy web portal had, so agents kept getting pulled back to desktop. Closing that gap is why I was brought on.
Users Leaving Mid-Task
Mobile drop-off ran well above what the portal saw for the same actions.Support Absorbing the Overflow
Over 15,000 calls a month came from members who got stuck on the app.Half the Portal Wasn't on Mobile Yet
Several web portal features hadn't made it into the app, so agents had to switch back to desktop to finish the task.
Discovery
UX Audit & Key Findings
Before touching any screens, I ran a UX audit against NN Group heuristics and cross-checked it with two quarters of analytics and support ticket data. Four patterns kept showing up, and each one was quietly costing the business money.
Unclear Call-to-Action
"I wasn't sure if tapping that would submit my claim or just save it."
— Insurance Agent
About 3 in 5 users hesitated or picked the wrong action on core screens during user interviews. Second-guessing what a button does slows every client interaction and erodes trust in the tool itself.

Lack of Search Functionality
"It takes me longer to find the record than to actually do the work." — Support Staff
Finding the right plan took over 90 seconds on average. Instead of finishing on their phone, members gave up and switched to desktop.

Complex Navigation
"I know this feature exists somewhere, I just never know which menu it's hiding in." — Product Analyst
Users took 4 to 6 taps to reach screens that should've taken 2. Every extra tap meant more people abandoning the task, and abandoned tasks were flowing straight into support call volume.
Unclear Call-to-Action
"I wasn't sure if tapping that would submit my claim or just save it."
— Insurance Agent
About 3 in 5 users hesitated or picked the wrong action on core screens during user interviews. Second-guessing what a button does slows every client interaction and erodes trust in the tool itself.

Complex Form Structures
"On mobile I have to scroll left and right just to fill out one form. I'd rather just do it on desktop where I can see the whole thing at once." — Insurance Agent
Claims and enrollment forms had the highest drop-off in the app, around 40%. Biggest single driver of support calls.
Solution
Solutions Mapped to the Audit Findings
Each fix below responds directly to a finding from the audit. The goal wasn't a redesign for its own sake, it was to solve the specific problems agents were already running into every day.